The State of Food Security and Nutrition in the World (SOFI) 2026, released jointly by FAO, IFAD, UNICEF, WFP and WHO, arrives with a message that is,
on its face, encouraging: global hunger has fallen for a third consecutive
year, and Africa's decade-long deterioration appears to have halted. But
beneath these headline numbers lies a more unsettling finding, one that
reframes the entire food security debate away from availability and toward
affordability.
Even as fewer people go hungry in the strict caloric sense, roughly a third of humanity still cannot afford to eat well. The report's central argument is that ending hunger and ending malnutrition are no longer the same fight, and that the second, harder battle — making a healthy diet economically accessible is the one the world is currently losing in the places that need it most.
The Headline Numbers, and their Limits
SOFI 2026 estimates that 7.8 per cent of the global population, between 608 and 696 million people, with a point estimate of 645 million, faced hunger in 2025, down from 8.1 per cent in 2024 and 8.6 per cent in 2022. This is real progress, and it is broad-based: Asia, Latin America, and the Caribbean have shown sustained improvement, while Africa's prevalence of undernourishment, which had climbed almost every year since 2017, edged down from 20.3 to 20.0 per cent.
Yet two qualifications matter more than the topline trend. First, in absolute terms, the world remains worse off than before the 2030 Agenda was adopted: the share of hungry people is only marginally below 2015 levels (7.8 per cent versus 8.0 per cent), but the *number* of hungry people has risen by roughly 50 million, because global population growth has outpaced the rate of improvement. Second, Africa's marginal percentage-point improvement did not translate into fewer hungry Africans in absolute numbers, again because population growth absorbed the gain. For the first time, Africa now hosts more hungry people (309 million) than Asia (292 million); it is a historic inversion that reflects Asia's demographic weight and sustained agricultural investment as much as it reflects Africa's stagnation. The report is candid that even its more optimistic scenario, that a projected 20 per cent reduction in undernourishment by 2030 would still leave 510–520 million people hungry, 56 per cent of them in Africa, meaning SDG Target 2.1 will almost certainly be missed. The 2026 Middle East conflict is flagged as a fresh downside risk to this already fragile trajectory, illustrating how food security projections remain hostage to geopolitical shocks well outside the sector's control.
Affordability as the New Fault Line
The report's most consequential analytical move is elevating the Cost of a Healthy Diet (CoHD) introduced as a benchmark indicator only in 2020 to the centre of its diagnosis. The CoHD does not measure what people actually eat; it measures the theoretical floor price of the cheapest possible combination of foods that would meet minimum nutritional adequacy in a given country. That distinction is important; it is a conservative, best-case estimate of cost, not a measure of typical spending, which means the real burden on households is almost certainly higher than the indicator suggests.
Globally, the CoHD rose from 2.94 PPP dollars in 2017 to 3.44 in 2021 and 4.28 in 2025, a cumulative increase of roughly 46 per cent in under a decade, far outpacing general inflation in most regions. Using this benchmark, the report estimates that 2.69 billion people, or 32.7 per cent of humanity, could not afford a healthy diet in 2025. That figure has actually declined from 2.97 billion (37.4 per cent of the global population) in 2021, and the report interprets this as evidence that, on average, incomes have grown faster than food prices. But this global average masks a sharply divergent regional story, unaffordability is falling in Asia, Latin America and the Caribbean, and Northern America and Europe, while it is rising in Africa, where 66.6 per cent of the population that is two in three people could not afford a healthy diet in 2025, more than double the rate in Asia (28.9 per cent) or Latin America and the Caribbean (25.7 per cent). In other words, the global affordability crisis is not receding uniformly; it is consolidating in the region least equipped to absorb it, even as that same region shows nominal progress on caloric hunger. This divergence between the undernourishment indicator and the affordability indicator is arguably the report's most important analytical contribution; a country or region can look like it is "winning" against hunger while losing ground on diet quality and nutrition security.
Why Healthy Diet Costs so Much
SOFI 2026 devotes an entire chapter to decomposing what drives the CoHD, and the underlying producer-support data suggest a common policy reflex may be misplaced: the tendency to treat food price problems as primarily a production or farm-gate issue. The report finds that animal source foods, fruits and vegetables together account for nearly 70 per cent of the CoHD, despite starchy staples supplying half the dietary energy in the reference basket. Structurally, the cost driver is not scarcity of calories but scarcity of nutrient density delivered affordably. In Africa, animal source foods are the most expensive category, with 69 per cent of African countries falling into the highest-cost tercile globally for that food group; in Latin America and the Caribbean, vegetables, not meat or dairy, are the costliest component, a reflection of that region's logistics and transport bottlenecks rather than production shortfalls.
Perhaps the report's sharpest finding is that 70 to 75 per cent of what consumers pay for food accumulates after the farm gate in midstream processing, transport, cold chains and wholesale logistics, yet a review of agricultural policy data (via the FAPDA database) finds that government support remains overwhelmingly concentrated on primary production and, more specifically, on staple grains, sugar, dairy and oil crops, which together receive roughly 70 per cent of global producer support. This is a structural mismatch: the policy toolkit is aimed at the 25–30 per cent of the cost problem located at the farm, while largely ignoring the 70–75 per cent of the cost problem located in the middle of the value chain. The report's modelling reinforces this: a 10 per cent efficiency shock to fruit and vegetable value chains alone produces a 7.54 per cent reduction in the relative CoHD, and midstream logistics investment yields disproportionately large gains in Latin America and the Caribbean specifically, where transport frictions, not farm productivity, are the binding constraint.
This has a direct bearing on subsidy design. The report's simulations show that production subsidies aimed at already-cheap staples generate negligible or even counterproductive effects on the CoHD, by pulling land, labour and capital away from the nutrient-dense food groups that actually drive costs. By contrast, a 10 per cent production subsidy targeted at higher-cost food groups reduces the CoHD by over 8 per cent in Latin America and the Caribbean and 7.5 per cent in North America, Europe and Oceania, though the same intervention is far less effective in Africa and Asia (4.4 and 4.7 per cent respectively), suggesting that subsidy-based tools have sharply diminishing returns in the regions with the weakest underlying infrastructure. This is an important corrective to any one-size-fits-all subsidy agenda: fiscal efficiency of the same instrument varies by a factor of nearly two across regions, meaning transplanting a successful policy from one geography to another without adapting to local structural constraints is likely to underperform or backfire. It is worth noting that these are modelled projections rather than observed outcomes, and are best read as indicative of relative magnitude and direction rather than precise point forecasts.
The Nutrition Transition Nobody is Managing Well
The same affordability mechanism helps explain a parallel, slower-moving story about diet quality and nutrition outcomes, most of which the report says are off track for 2030. Minimum dietary diversity, a newly adopted SDG indicator as of March 2025, shows that only 30.8 per cent of children aged 6–23 months and 62.7 per cent of women of reproductive age consume a sufficiently varied diet, figures that have barely moved over the past decade. Meanwhile, adult obesity has climbed from 12.1 per cent in 2012 to 16.2 per cent in 2024, comfortably breaching the target of halting its rise by 2025, with a 2030 projection of 18.6 per cent. Anaemia among women is also worsening rather than improving, moving further from its target trajectory each year. Read together with the affordability data, this paints a picture of a double burden: undernutrition persists in the same populations, often within the same countries and households where obesity and micronutrient deficiency are simultaneously rising, a pattern consistent with diets that are calorically sufficient but nutritionally poor because the more nutritious food groups remain priced out of reach.
Policy Implications and Unresolved Tensions
The report's prescriptive chapters call for a two-axis approach: expanding the supply of nutrient-dense foods (through R&D reoriented toward fruits, vegetables and legumes, secure land tenure and functioning input markets) while simultaneously reducing structural per-unit costs across the value chain (cold chains, transport, post-harvest loss reduction, trade facilitation). It explicitly warns against treating these as substitutes; supply-side gains without demand-side management risk triggering new price spikes, while cost-reduction efforts pursued without regard to environmental or labour externalities risk creating what it calls "hidden" societal costs that the CoHD indicator, being a pure market-price measure, does not capture.
There is an unresolved tension here that the report acknowledges but does not fully resolve: reforms to the value chain are described as inherently redistributive, meaning that some actors like traders, protected staple producers, and certain input suppliers stand to lose from exactly the kind of midstream efficiency gains the report recommends. Whether governments have the political capital to reallocate 70 per cent of agricultural support away from staples and toward fruits, vegetables and animal source foods, in the face of entrenched producer lobbies, is a governance question the technical modelling cannot answer. Equally, the report's own regional prioritisation - animal source food reform in Africa, post-harvest handling in Asia, logistics in Latin America and the Caribbean, labour-saving technology in high-income regions is analytically elegant but implicitly acknowledges that a global institution can identify entry points without being able to guarantee the domestic political sequencing required to act on them.
A Note on Measurement, and why it Matters
It is worth pausing on how the CoHD is actually constructed, because the methodology shapes what the headline numbers can and cannot tell policymakers. The indicator draws on price data from the World Bank's International Comparison Program, which was designed for purchasing-power comparisons across countries, not specifically for costing diets. Prices are collected only periodically; the most recent rounds were 2017 and 2021, meaning the 2025 CoHD figures cited throughout the report are themselves partly extrapolated from older price data adjusted for food inflation, not direct observations. The ICP also records only one national average price per item, which erases the substantial within-country variation the report itself flags as significant: its case studies of Ghana, Nigeria and Pakistan show that national averages can mask large seasonal and subnational swings in what a healthy diet actually costs a given household. This is not a minor caveat. A national government trying to time a subsidy or social protection intervention around harvest seasons, or target it to the regions where affordability has deteriorated most, cannot do so reliably using the global CoHD alone; it needs the kind of granular, high-frequency national price data the report says most low- and middle-income countries do not yet systematically collect. The report is explicit that this data gap is itself a policy priority, not just a technical footnote; without it, the sophisticated regional prescriptions in the report risk being implemented as blunt, poorly targeted instruments.
What this Means going Forward
SOFI 2026's real contribution is not the modest, welcome
decline in the hunger headline, but its insistence that hunger and healthy-diet
affordability are diverging problems requiring different tools. Caloric
sufficiency is improving almost everywhere except Africa; economic access to
nutritious food is deteriorating specifically in Africa even as it improves
elsewhere; and the policy apparatus most governments still rely on, that is,
farm-gate support for staple grains is aimed at the smaller share of the cost
problem. If the report has one uncomfortable implication for policymakers, it
is that declaring victory on hunger reduction while leaving the midstream value
chain and the fruit-and-vegetable sector under-resourced will simply convert a
hunger crisis into a slower, more entrenched malnutrition and affordability
crisis, one that current agricultural budgets, as structured, are not built to
solve.
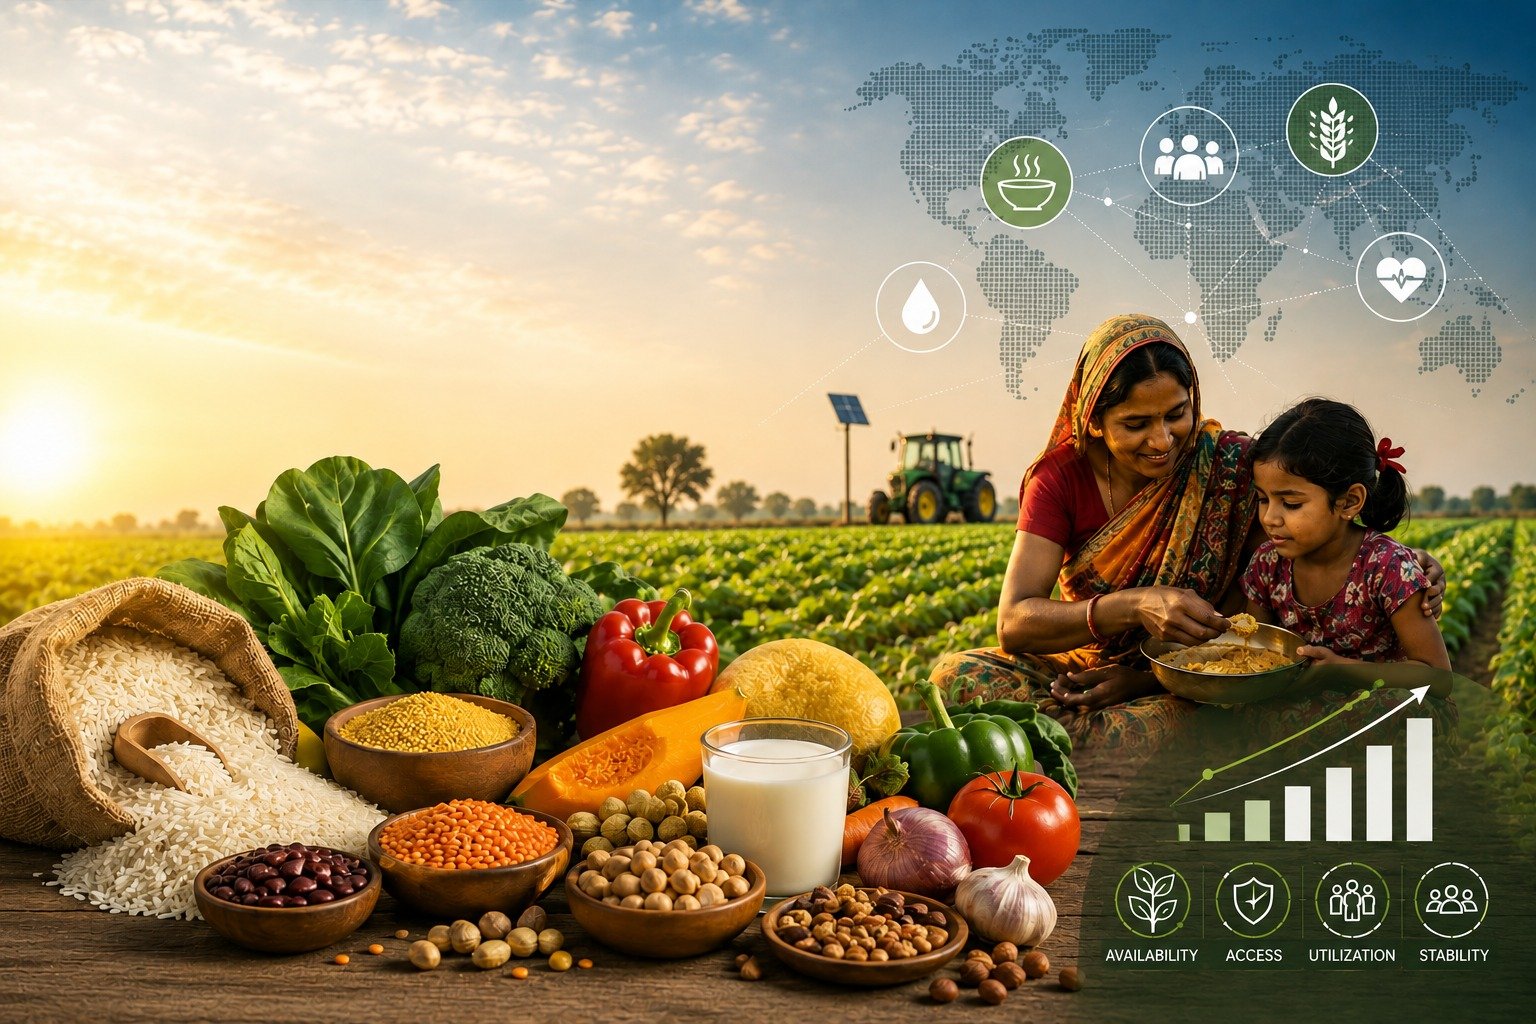
Cover Picture Credit: AI-generated