India's horticulture sector has quietly overtaken foodgrain in output, and its latest numbers confirm that growth is now coming from the field rather than from new land. The Department of Agriculture and Farmers Welfare's (DA&FW) Second Advance Estimates (SAE) for 2025-26 place total horticulture production at 3,777.76 lakh tonnes, a 1.9% rise over the 2024-25 final figure of 3,707.38 lakh tonnes. The area under cultivation edged up only 0.05% to 301.51 lakh hectares. Nearly the entire production gain, in other words, came from higher yield per hectare rather than expansion.
Productivity, Not Acreage, Is Driving Growth
This pattern is strengthening; a fifteen-year dataset built from DA&FW's Final and Advance Estimates releases, spanning 2011-12 to 2025-26 (Table 1), shows area growing at a compound annual rate of 1.88% since 2011-12, while production compounded at 2.78%. Productivity has therefore risen at roughly 0.9% a year on average, and the gap is widening in the latest release: productivity stood at 12.53 tonnes/hectare in 2025-26, up from 12.30 tonnes/hectare a year earlier, a 1.85% jump that outpaced area growth more than thirty-fold.
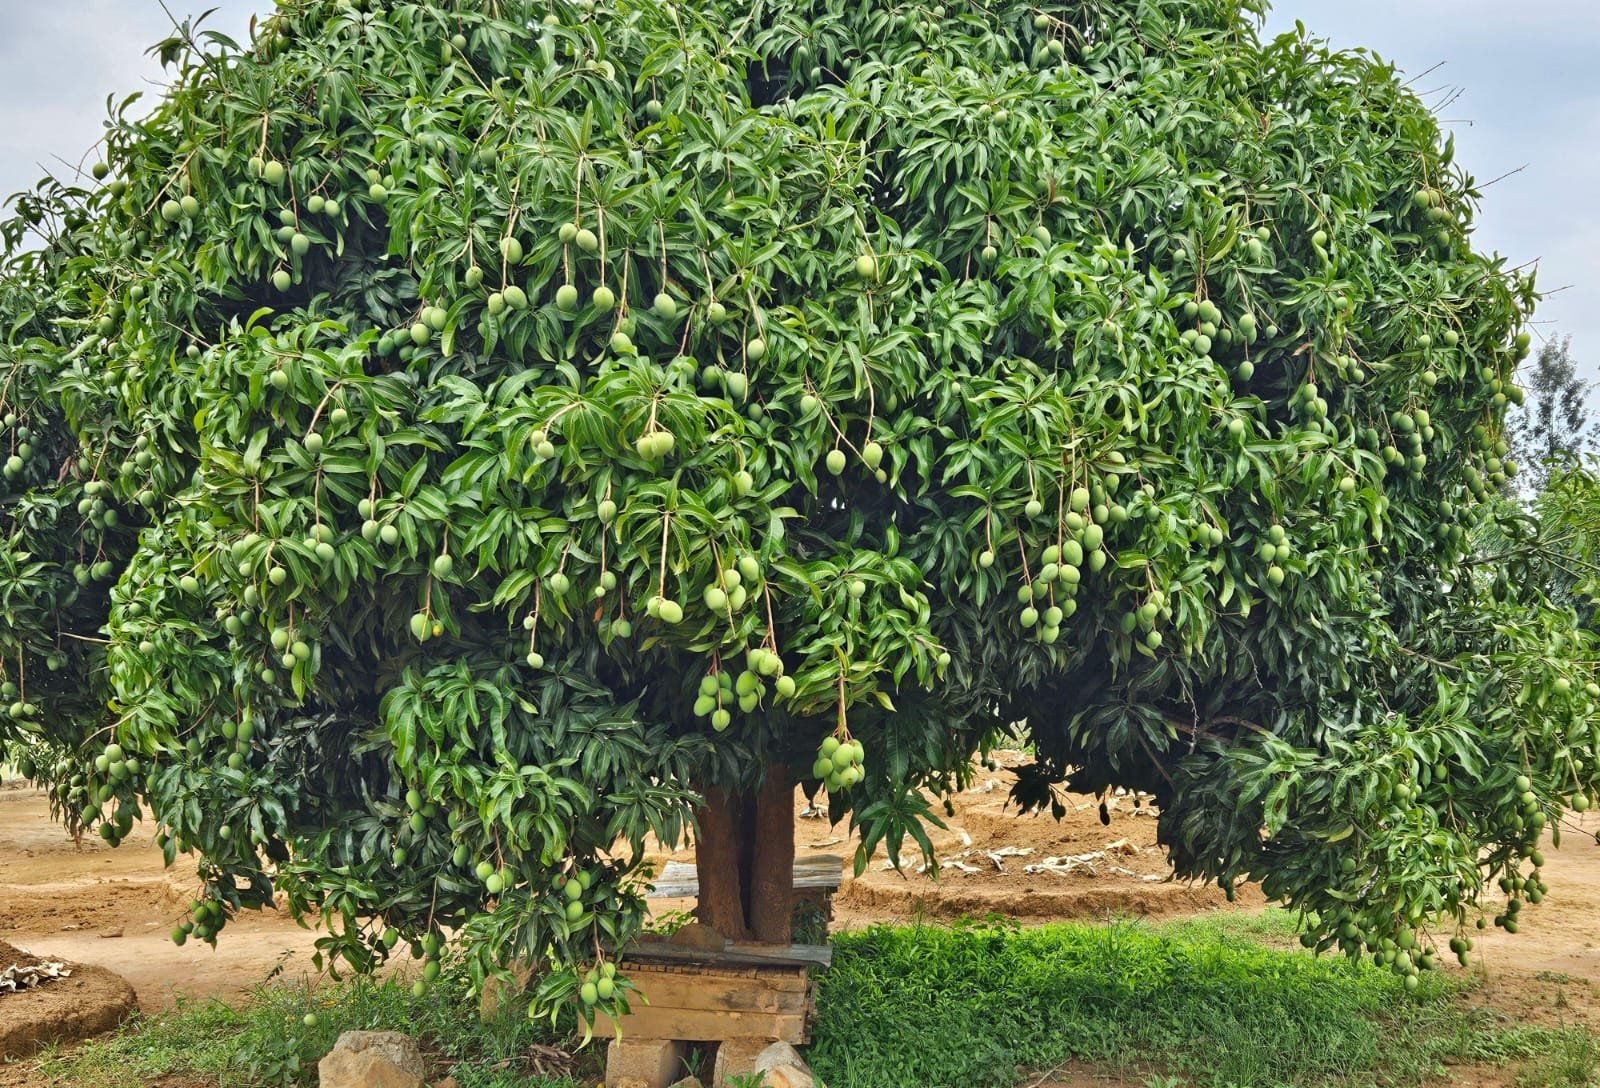
Crop-level figures confirm that banana production rose by 8.4% year on year, apple 6.5%, tomato 4.2%, potato 2.3%, mango 2.1% and guava 0.9%, each achieved with only marginal change in area sown.
A VAR-Based Outlook to 2029-30
Table 1 extends this fifteen-year run with a projection built on a two-variable Vector Autoregression (VAR), fitted on log-area and log-production. The model projects area reaching 324.86 lakh hectares and production 4,153.85 lakh tonnes by 2029-30, implying forecast compound growth of 1.88% for area and 2.40% for production, marginally below the historical trend, but still productivity-led. Implied productivity would rise from 12.53 to 12.79 tonnes/hectare over the four-year horizon (see Chart 1).
Aligning with Vision 2030
This trajectory tracks closely with the sector's own 2030 roadmap. The FICCI-GT report, ‘Vision 2030: Focusing on High-Value Horticulture for Atmanirbhar Bharat’, sequences the coming years into three phases. The Foundation Phase (2026-27) prioritises quality planting material and orchard rejuvenation, aligning with the productivity gains the model projects for that year. The Scale Phase (2027-29) shifts focus to post-harvest infrastructure and processing, the period over which projected production crosses the 4,000 lakh-tonne mark. The Premiumisation Phase (2029-30) aims to position India as a branded global supplier, by when projected output would exceed the sector's current fresh fruit and vegetable export base of USD 1.81 billion many times over, provided value addition keeps pace with volume.
The Policy Gap: From Field to Market
The gap in this equation sits on the demand side: moving the marginal tonne to market without loss. Post-harvest losses of 8-15% persist despite 1,710 identified horticulture clusters, over 55,000 post-harvest facilities and roughly 8,800 cold storage units nationally. As productivity-led output rises faster than storage and logistics capacity, that loss share applies to a larger base each year.
For policymakers, the numbers argue against treating horticulture as a land-expansion story. With cultivated area now essentially static and productivity carrying growth, the binding constraint on farmer income over the next four years is less likely to be how much India grows, and more likely to be what happens to each tonne after harvest.
Table 1: India's Horticulture Area, Production, Productivity and Y-o-Y Growth, 2011-12 to 2029-30
|
Year |
Area (lakh ha) |
Production (lakh tonnes) |
Productivity (t/ha) |
Area Y-o-Y |
Production Y-o-Y |
|
2011-12 |
232.42 |
2,572.77 |
11.07 |
– |
– |
|
2012-13 |
236.94 |
2,688.47 |
11.35 |
1.94% |
4.50% |
|
2013-14 |
241.98 |
2,773.52 |
11.46 |
2.13% |
3.16% |
|
2014-15 |
234.10 |
2,809.86 |
12.00 |
-3.26% |
1.31% |
|
2015-16 |
244.72 |
2,861.88 |
11.69 |
4.54% |
1.85% |
|
2016-17 |
248.51 |
3,006.43 |
12.10 |
1.55% |
5.05% |
|
2017-18 |
252.36 |
3,106.75 |
12.31 |
1.55% |
3.34% |
|
2018-19 |
257.37 |
3,110.52 |
12.09 |
1.98% |
0.12% |
|
2019-20 |
264.82 |
3,204.71 |
12.10 |
2.89% |
3.03% |
|
2020-21 |
274.76 |
3,346.03 |
12.18 |
3.76% |
4.41% |
|
2021-22 |
280.42 |
3,471.79 |
12.38 |
2.06% |
3.76% |
|
2022-23 |
284.38 |
3,554.82 |
12.50 |
1.41% |
2.39% |
|
2023-24 |
290.86 |
3,547.44 |
12.20 |
2.28% |
-0.21% |
|
2024-25 |
301.36 |
3,707.38 |
12.30 |
3.61% |
4.51% |
|
2025-26 (2nd AE) |
301.51 |
3,777.76 |
12.53 |
0.05% |
1.90% |
|
2026-27 (P) |
307.24 |
3,869.99 |
12.60 |
1.90% |
2.44% |
|
2027-28 (P) |
313.05 |
3,963.30 |
12.66 |
1.89% |
2.41% |
|
2028-29 (P) |
318.93 |
4,057.90 |
12.72 |
1.88% |
2.39% |
|
2029-30 (P) |
324.86 |
4,153.85 |
12.79 |
1.86% |
2.36% |
Source: Author's compilation from DA&FW Final Estimates (2011-12 to 2024-25) and Second Advance Estimates 2025-26; 2026-27 to 2029-30 (P) are author's VAR(1) projections, not government figures.
Chart 1: Area & Production — Trend and VAR Projection to 2029-30
Cover Picture Credit: Pexels